Metrics are only accessible for Users with Admin permissions.
From Revenue trends, to number of upcoming Deliveries, and everything in between. Metrics visually breakdown how you’re doing currently compared to previous seasons so you can have a better grasp on how you’re performing.
Navigate to the “Metrics” icon in the upper left corner of your browser window.
Here you’ll find various graphical and numerical representations of your Orders and Items.
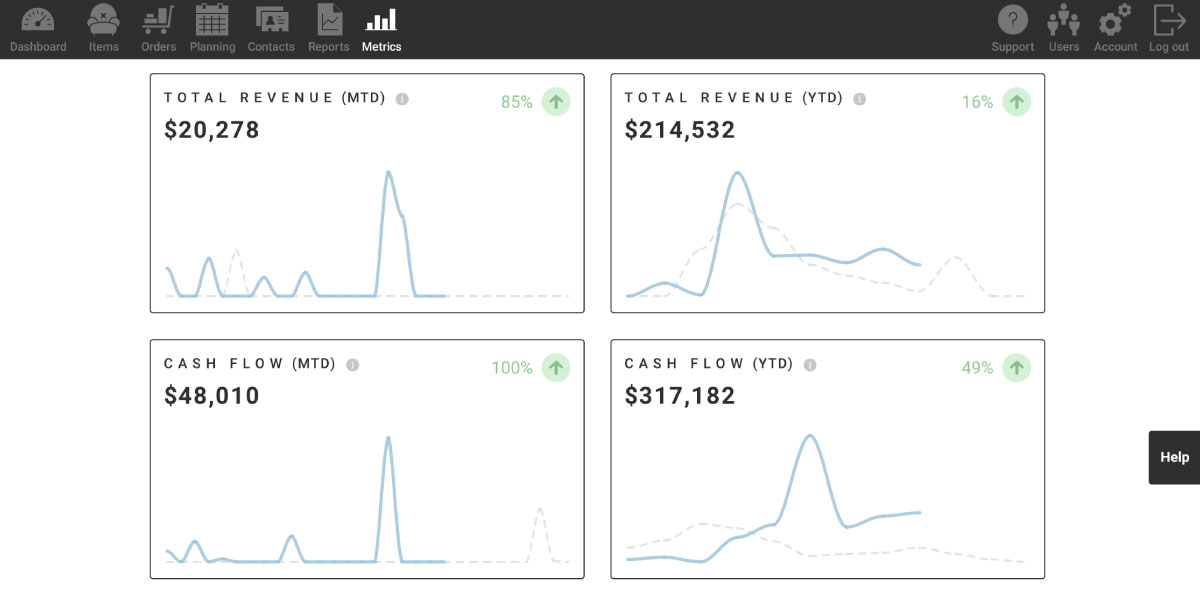
Here are the types of Metrics available:
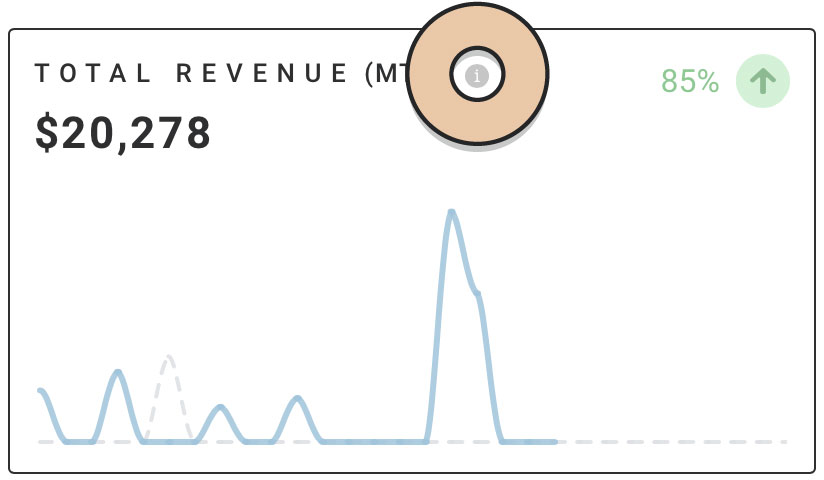
- Total Revenue
- Cash Flow
- Average Order
- Conversion Rate
- Total Proposals
- Order Tracker
- Number of Upcoming
- Delivery Fees
- Delivery Revenue
- Days Open
- Accounts Receivable
- Processed Payments
- Payouts
In the upper right corner of most Metrics, you’ll find a green or red Rate of Change arrow, preceded by a percentage.
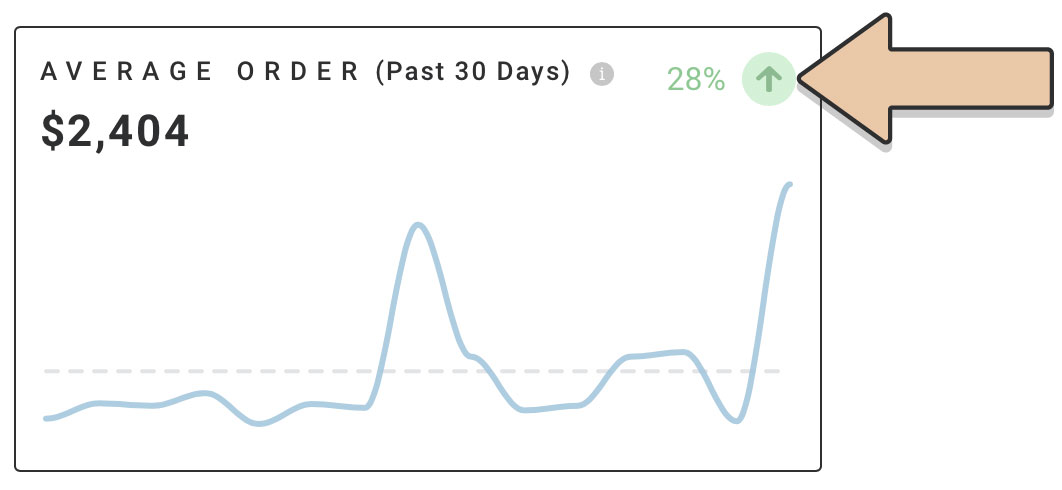
Rate of Change represents the percentage rate that the given Metric has changed compared to the previous period.
For example, Metrics displaying MTD (Month-to-Date) will be comparing to the previous month, whereas YTD (Year-to-Date) Metrics will compare to the previous year.
The percentage amount in green or red represents by how much you’ve moved up or down compared to last period.
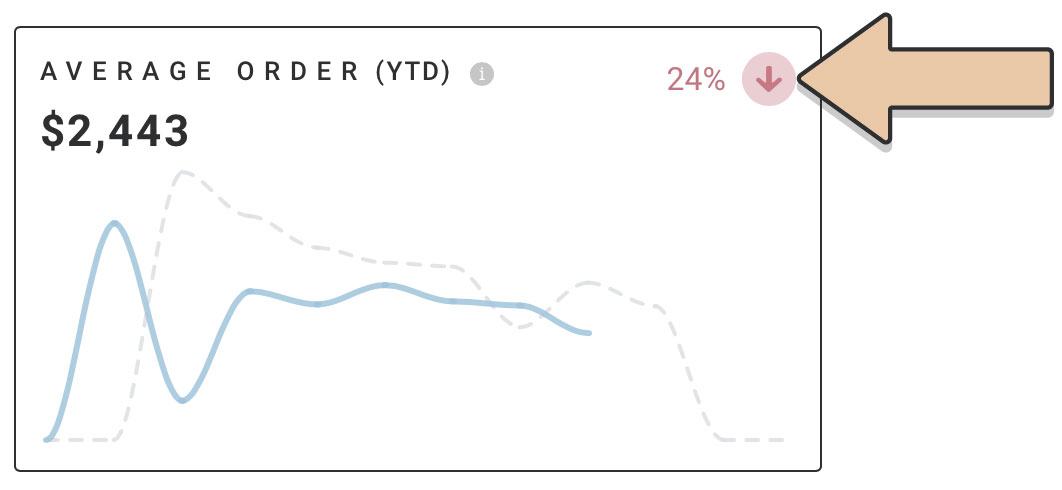
A green arrow and percentage mean that you’re performing better than the previous period. Whereas a red arrow and percentage indicates that last period performed better.
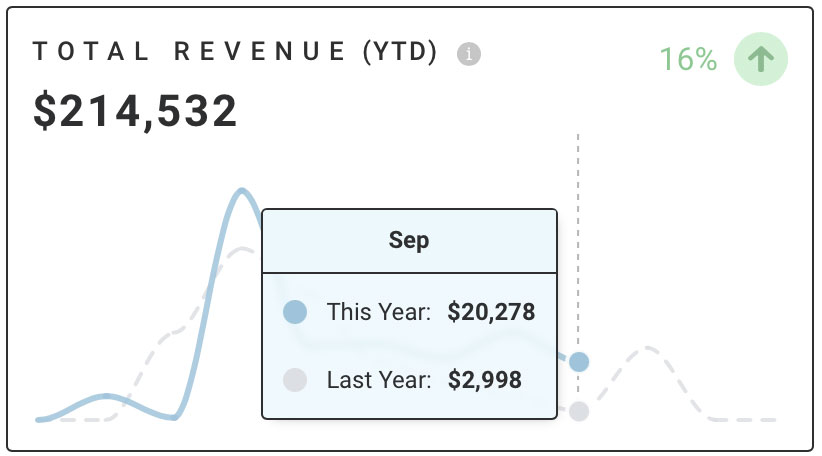
Hover over a graph to display specific data point values. A pop-up will appear to indicate the value for the chosen point on the graph.
For example, Total Revenue (YTD) will display the Month, this year’s values, and last year’s values for that same month.
For more information on how values are calculated, click the info icon to the right of the Metric title.
Metrics do not include Sale Orders and values will not include Sales Tax unless specified otherwise.
Also check out how Dashboard Quick Metrics can help in your day-to-day planning.