Metrics are only accessible for Users with Admin permissions.
Navigate to the Metrics icon in the upper left corner of your browser window.
Average Order value is calculated by:
Total value of Orders in period ÷ Total number of Orders in period
Average Order calculations are based on Event Date for Confirmed Orders. These values do not include Sales Tax.
Average Order Metrics are visualized in two graphical time periods:
- Average Order (Past 30 Days)
- Average Order (Year-to-Date)
Average Order (Past 30 Days)
Average Order value by month is calculated for the past 30 days, compared to the value of each Order in previous period.
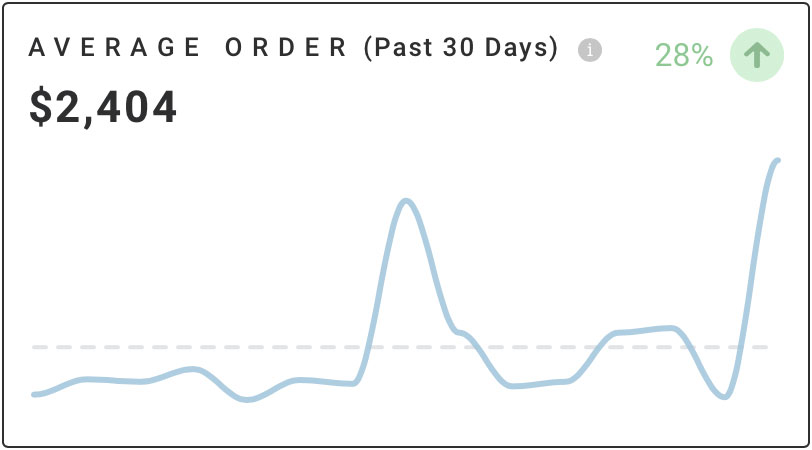
The x-axis represents Order number and the y-axis represents dollar value.
The Average Order value is represented by a straight gray dashed line where each individual Order is plotted in numerical Order around it. This is to show the range of Order value over the past 30 days compared to the average Order value.
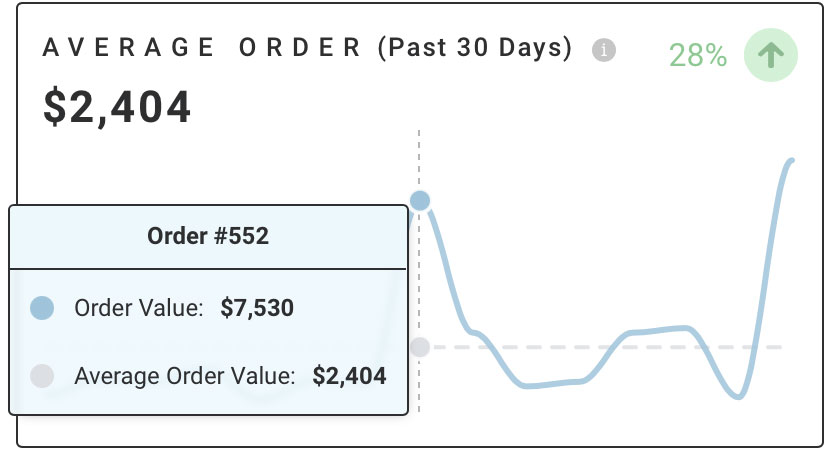
Hover over a data point on the graph to display specific values. For Average Order (MTD), the data point pop-up will display the Order number, the Order value in blue, and the Average Order value in gray.
The Rate of Change arrows signify the percentage change from last month to this month.
Average Order (YTD)
The Year-to-Date representation of Average Order value is calculated for each month Year-to- Date and compared to the value for the previous year.
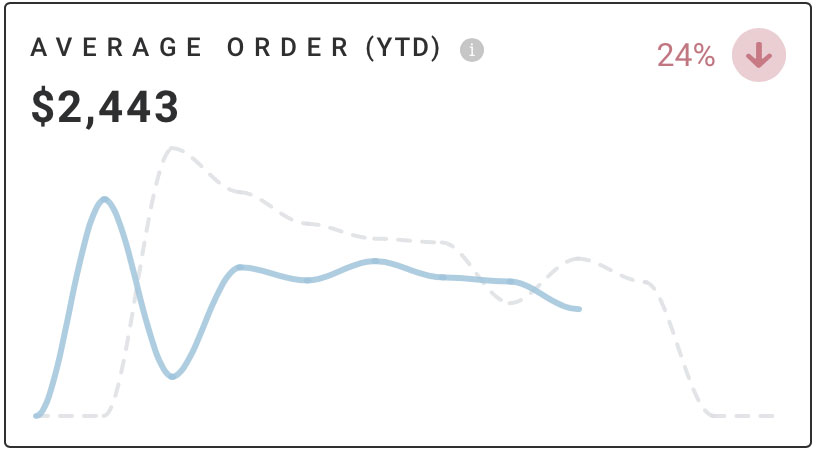
The x-axis represents time in months and the y-axis represents dollar value.
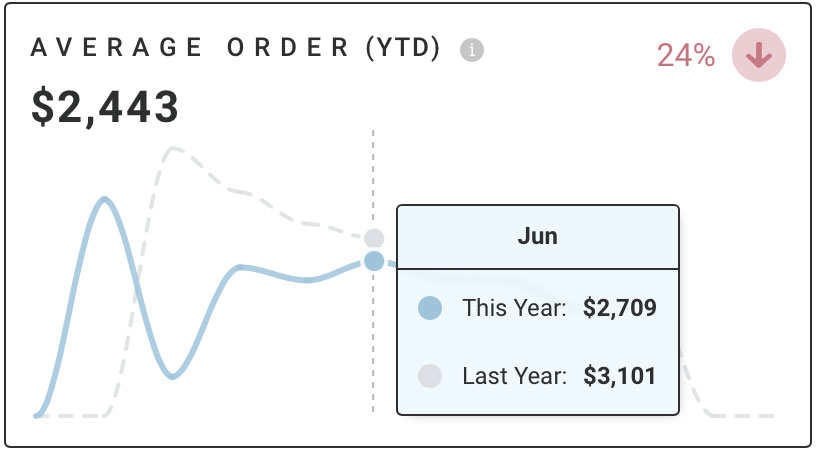
Hover over a data point on the graph to display specific values. For Average Order (YTD), the data point pop-up will display month, this year’s values in blue, and last year’s values in gray.
The Rate of Change arrows signify the percentage change from last year to this year.