Use this report to see how your Revenue over a particular time period compares to the investment you have in your Inventory Items. This report can be helpful when deciding what items to liquidate or purchase more of for the future.
You can find reports within RW Elephant by navigating to the “Reports” icon in the upper left corner of your browser window.
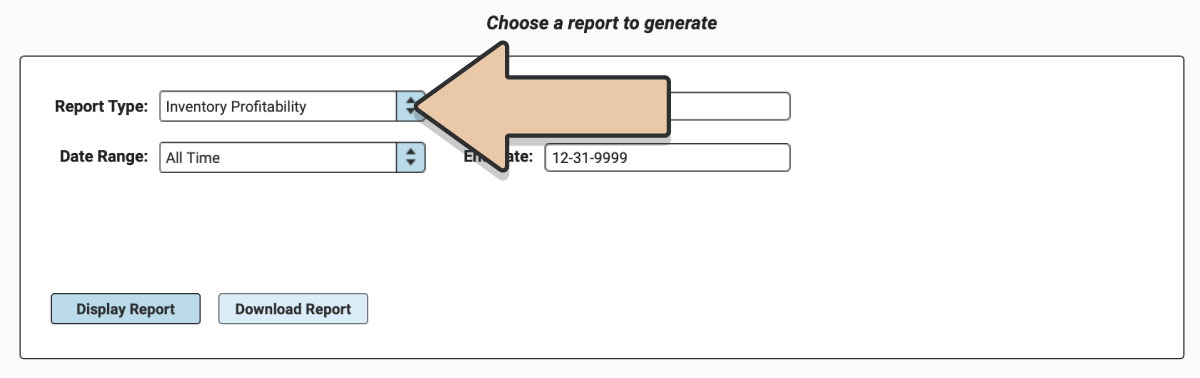
Use the Report Type drop-down menu to choose the “Inventory Profitability.”
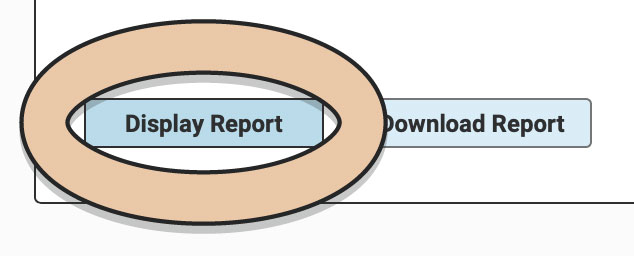
Select a prefixed date range or enter a specific date range you’d like the report to reflect and click the “Display Report” button.
A table will display of the Report that can be filtered and rearranged right within the Reports section of RW.
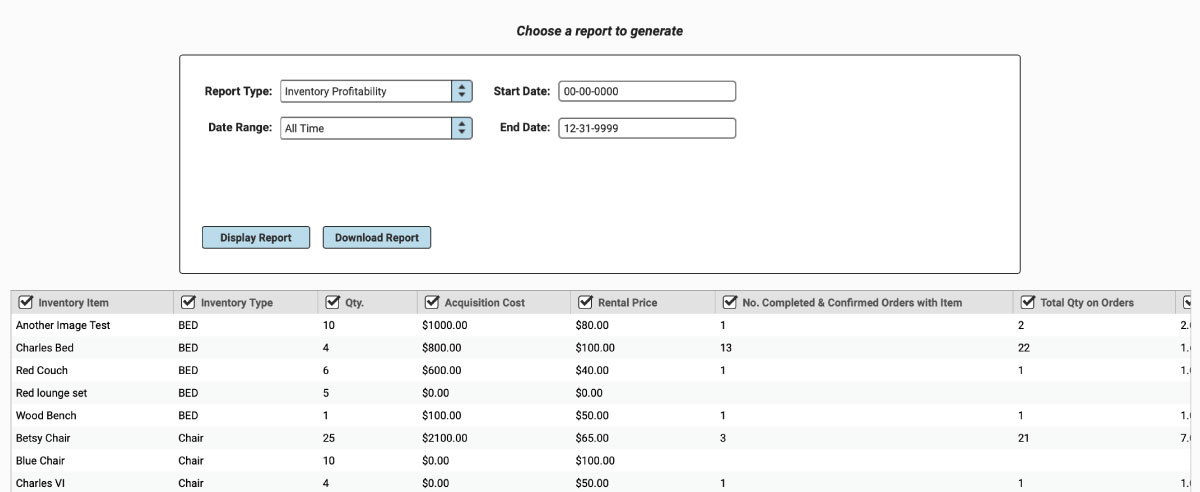
Untick column headers to hide them or drag and drop columns to rearrange them before downloading.
When you’re ready to download, click the “Download Report” button and the Report will generate as a spreadsheet saved to your computer.
Once downloaded, the next time you generate the Report, RW will remember your previous filters and arrangements for quicker downloading.
The Inventory Profitability Report includes the Item, Type, and Current Quantity for the Item.
It also includes the Total Acquisition Cost* of all of quantity of that Inventory Item you’ve acquired as well as the Unit Rental Price.
The Total Number of Orders (Completed and Confirmed) during the chosen timeframe will be displayed as well as all of the Quantity on those orders,the Average Quantity per Order and the Rental Revenue Generated from those Orders.
The Profit/Loss Column will calculate based on the Revenue minus the Total Acquisition Cost.**
The ROI will be the Revenue divided by the Total Acquisition Cost.
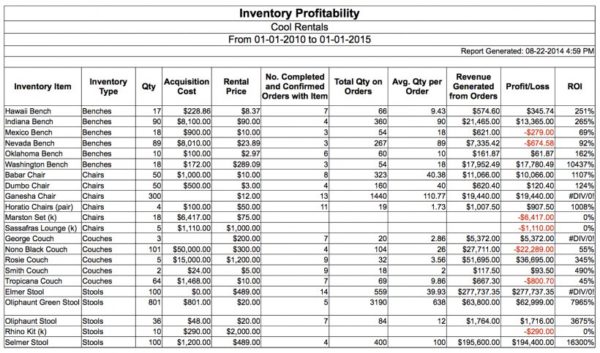
You’ll notice in the example above that there are some errors in the ROI column. This happens when an acquisition cost has not been included for an Inventory Item.
Please note that the Acquisition Cost for Kits <>calculated by adding up the Unit Acquisition Cost of each Inventory Item included in the Kit multiplied by the total number of Kits.
*Total Acquisition Cost includes all of the money spent on any of these Inventory Items that you’ve acquired ever (not just during the report’s timeframe). Also, it does not reduce the total cost by any amount (put another way, it does not subtract any sales revenue from the initial cost).
**While the Revenue column on this report only accounts for the timeframe of the report, the acquisition cost is from all time. That means that if you are looking at a report for the trailing 12 months but you acquired the pieces 18 months ago, it will not necessarily be an accurate picture of the trailing 12 months expenses versus revenue but it will still give you an interesting picture of each Inventory Item using costs and revenue.
Also see