Metrics are only accessible for Users with Admin permissions.
Navigate to the Metrics icon in the upper left corner of your browser window.
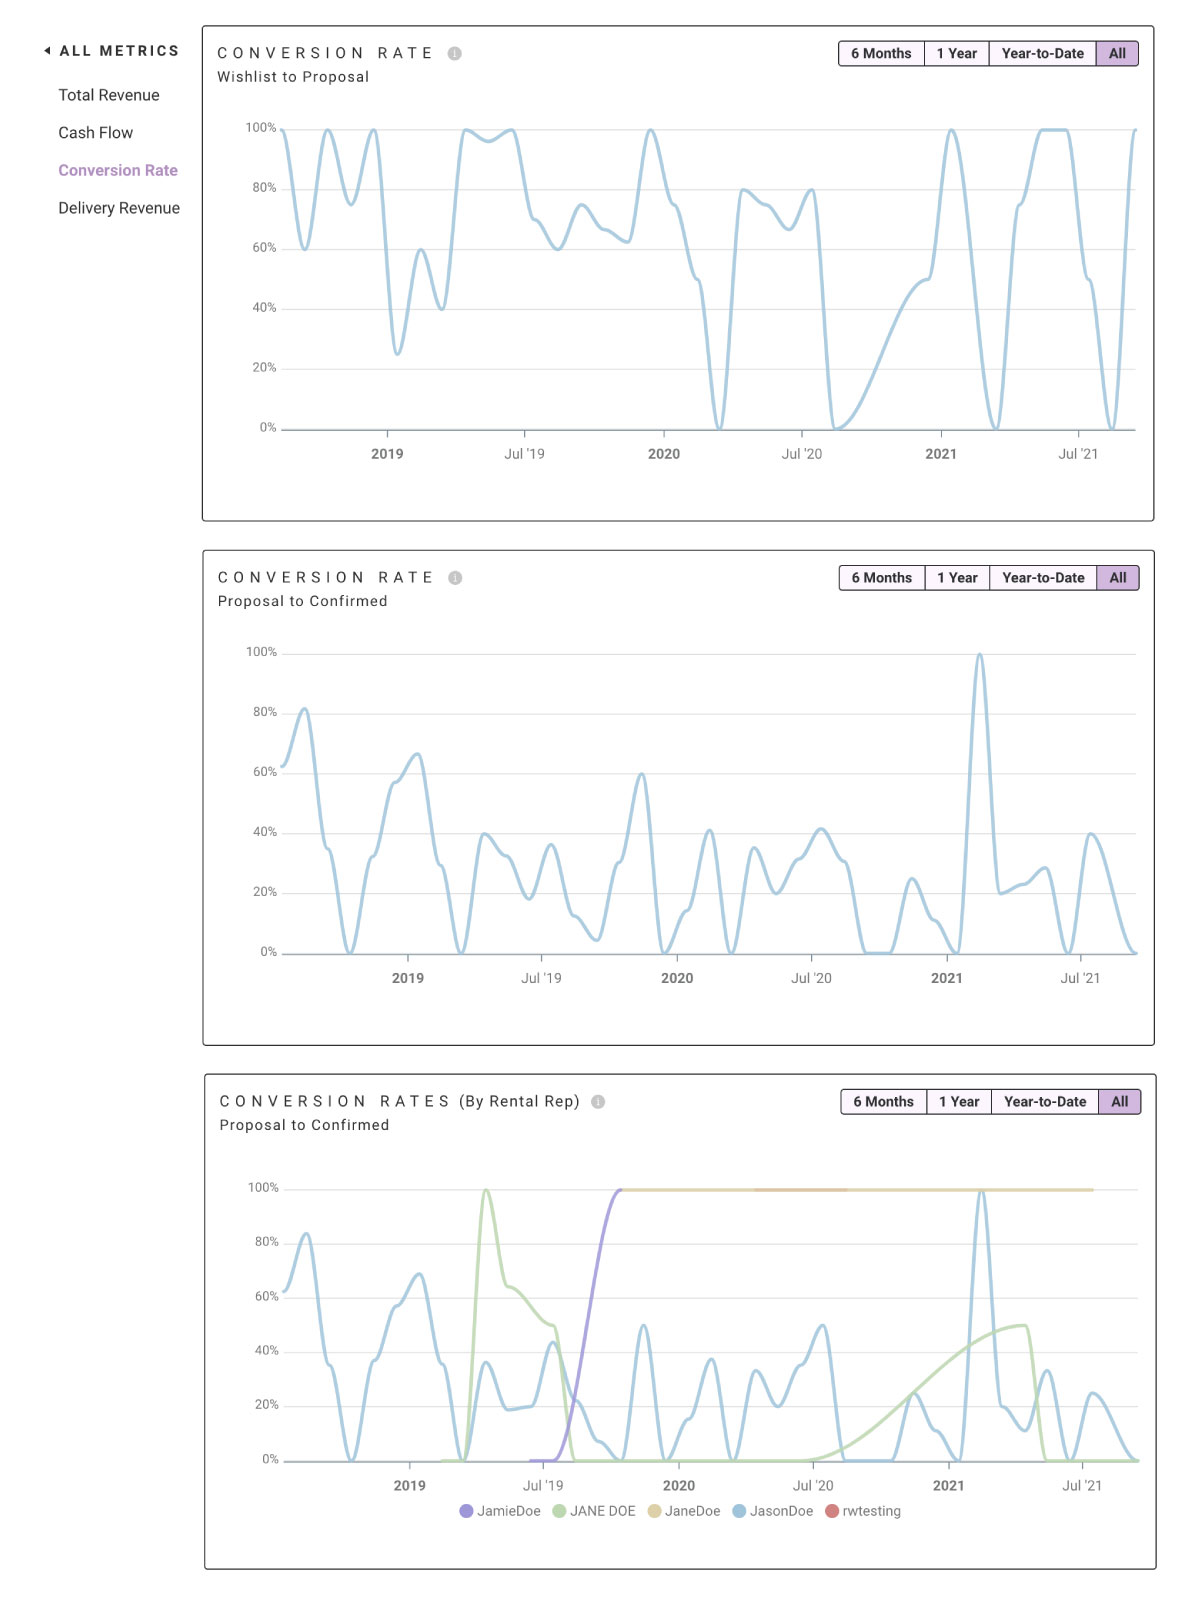
See Conversion Rates for Orders switching from:
- Wishlist to Proposal
- Proposal to Confirmed
Conversion Rates are calculated by the total number of Orders converted divided by the total number of Orders.
This Metric displays the rate of change for conversion rates over the course of the year by months.
*Heard Leaders can also see conversion rate comparisons for each of their Rental Reps.
Wishlist to Proposal
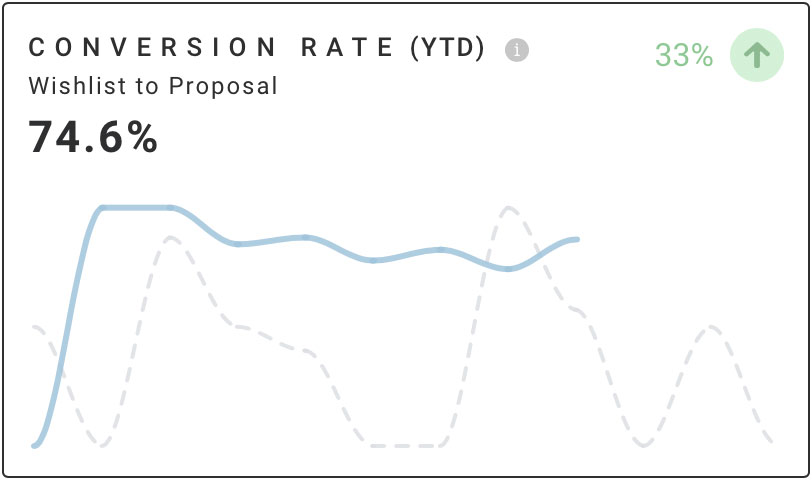
When an Order is submitted as a Wishlist, the hope is that the Order turns into a Proposal and it then Confirms.
The Conversion Rate Metric from Wishlist to proposal allows you to see the percentage amount of Wishlists that actually make it to the Proposal stage.
How it’s Calculated:
Total # of Proposals created from Wishlists ÷ Total # of Wishlists this year.
The Rate of Change arrows signify the percentage change of the Conversion Rate from last year to this year.
Proposal to Confirmed
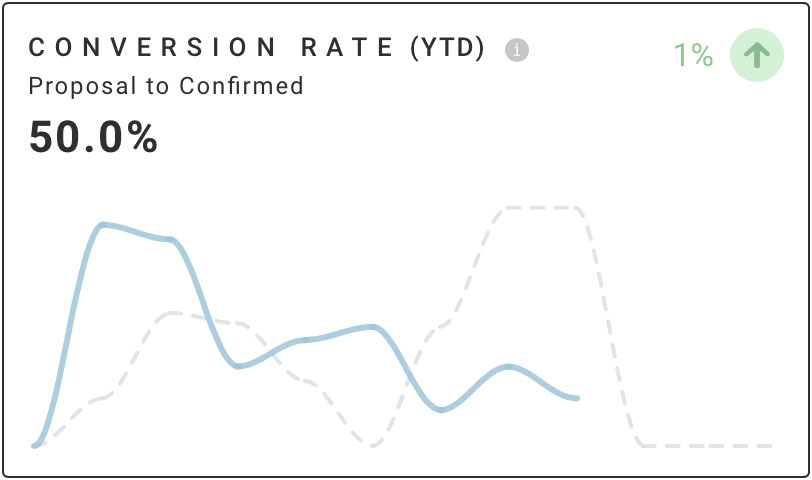
The goal for all Proposals is that they will eventually become Confirmed and not Cancelled. But sadly, not all leads will turn into paying Orders 100% of the time.
The Conversion Rate Metric from Proposal to Confirmed helps you see just how close you are to the goal of turning every Proposal into a Confirmed Order.
How it’s Calculated:
Total # of Confirmed Orders created from Proposals ÷ Total # of Proposals this year
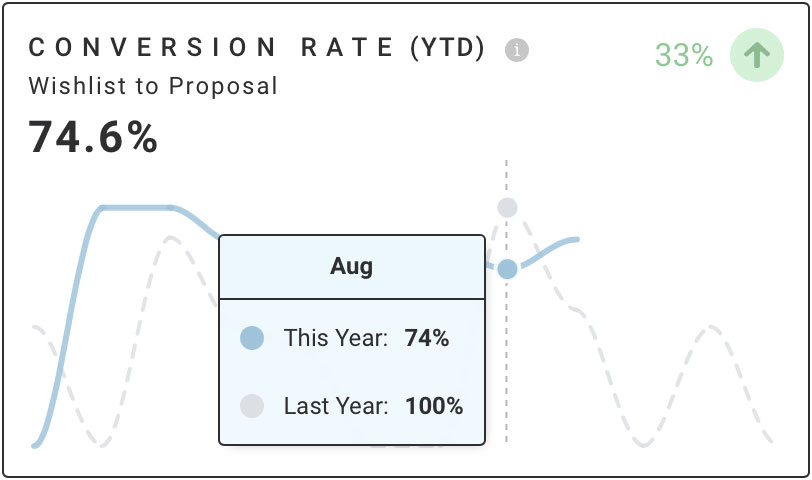
Hover over a point on the Metric to compare the conversion rate from a specific month this year to that same month last year.
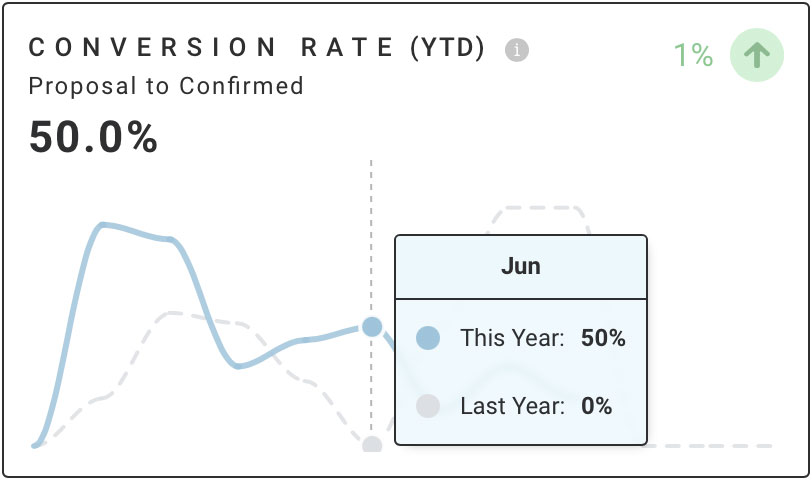
The Rate of Change arrows signify the percentage change of the Conversion Rate from last year to this year.
Conversion Comparison by Rental Rep
*This view is only available for Herd Leader Users who utilize the Rental Rep feature.
To compare Conversion Rates by Rental Rep, click anywhere within the graph to open additional views of this Metric.
This will open comparison Metrics for Total Conversions as well as Conversion Rates by Rental Rep.
See trends for each Rental Rep in direct comparison to other Reps.
Hover over a point on the graph to view specific comparisons for Reps at that point in time.
To zoom into a specific section of the graph, click on the left side of the area you’d like to view and drag the cursor to the right. This will zoom in to the selected section.
Click the home icon in the upper right corner to return to the normal view.
Select “ALL METRICS” in the upper left corner to navigate back to Metrics.