Metrics are only accessible for Users with Admin permissions.
Navigate to the “Metrics” icon in the upper left corner of your browser window.
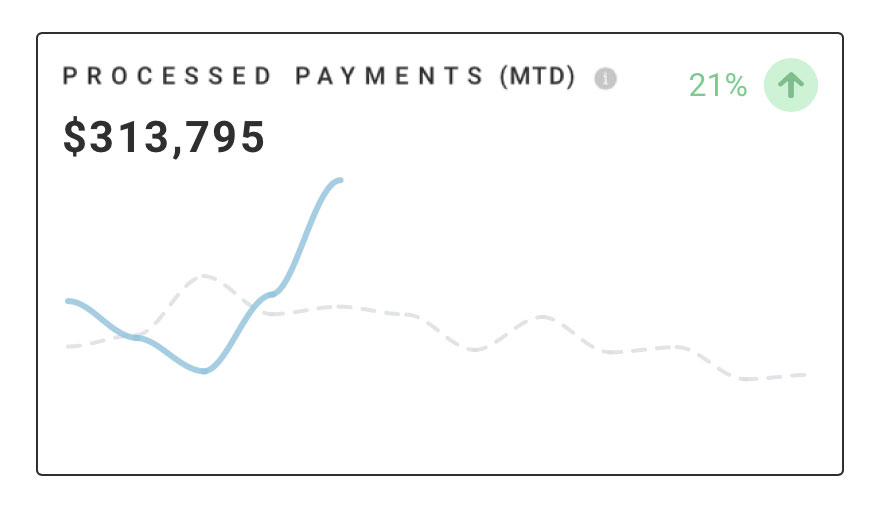
The Processed Payments Month-to-Date Metric displays payments processed through RW Pay in the last 30 days.
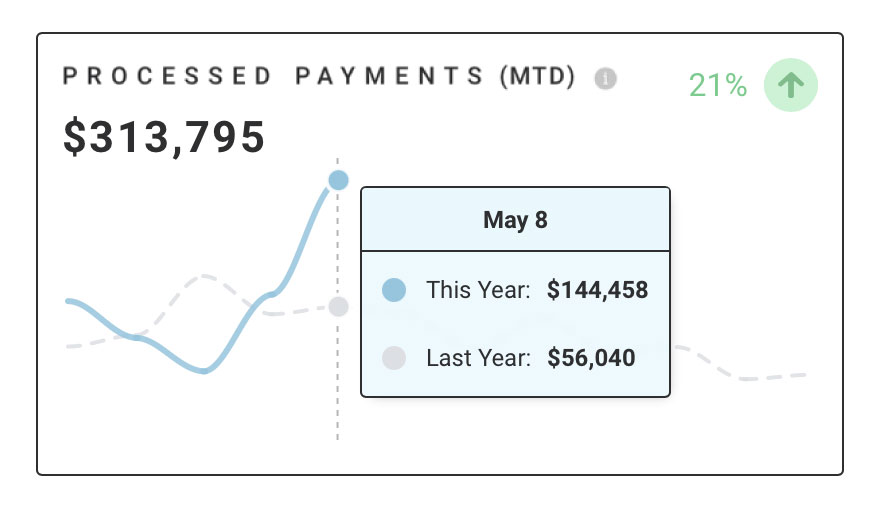
Hover over a data point on the graph to display particular values on specific days. The data point pop-up will display the day of the month, this month’s values in blue, and last month’s values in gray.
The Rate of Change arrows signify the percentage change from last month to this month.
Click anywhere in the graph to see details about these payments.
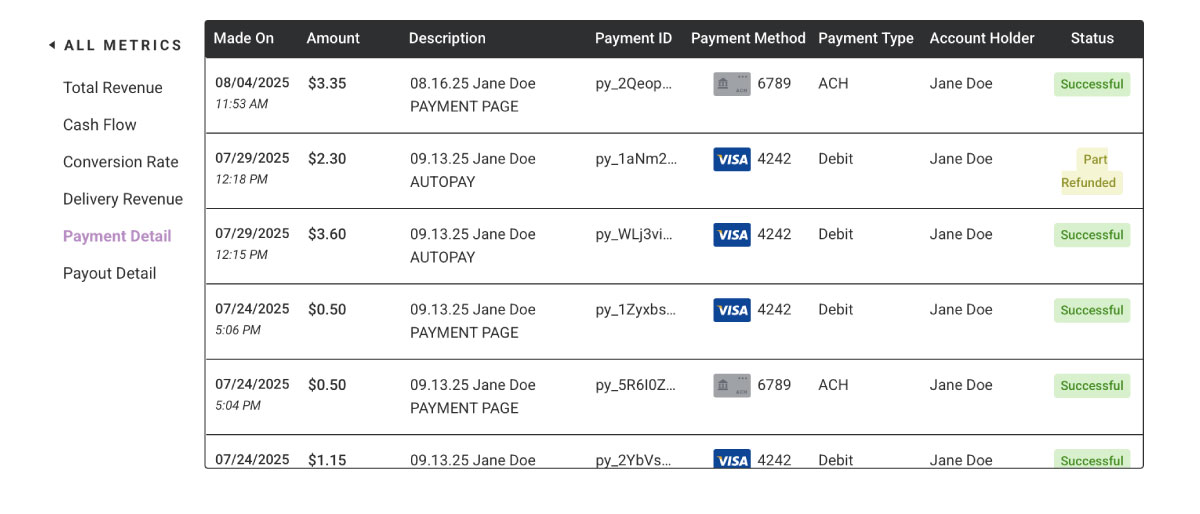
In the Payment Detail view, you’ll see the following columns.
- Made On: the date and time the payment was made
- Amount: the amount paid
- Description: Event Date, Client Name, and how it was paid
- Payment ID
- Payment Method: card brand and last 4 digits
- Payment Type: debit, credit, or ACH
- Account Holder
- Status: Successful, Failed, Refunded, or Part Refunded
Also, check out the Processed Payments by Payment Date Report.