Use this report to help evaluate inventory levels. While you may have some pieces that are well used and revenue generating, it may be the base that you have too many or too few of that item. This report will help you decide on the appropriate quantity for each of your inventory items.
You can find reports within RW Elephant by navigating to the “Reports” icon in the upper left corner of your browser window.
Use the Report Type drop-down menu to choose “Revenue by Item.”
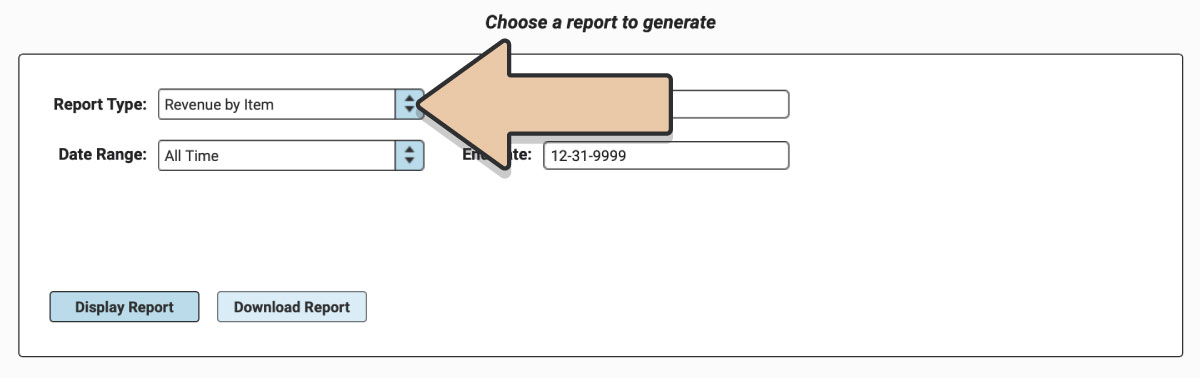
Select a prefixed date range or enter a specific date range you’d like the report to reflect.
Users on the Herd Leader plan can also enter specific Order Tags to narrow down report results. The report will only contain Orders that include the Tag specified. If you include multiple Tags, the report will only include Orders that have BOTH Tags (not either).
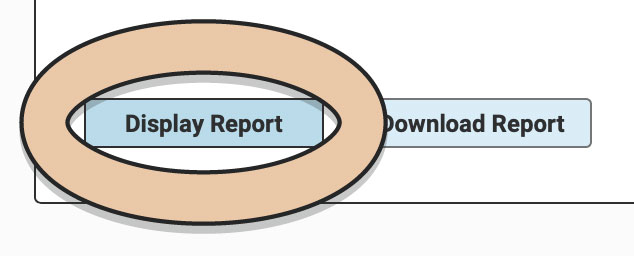
Click the “Display Report” button.
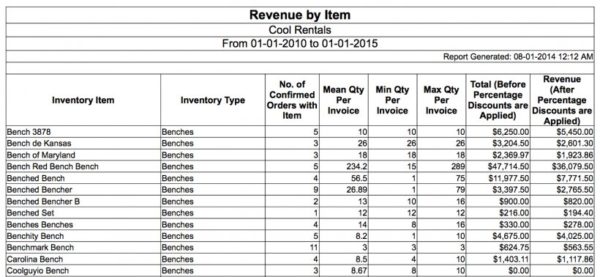
A table will display of the Report that can be filtered and rearranged right within the Reports section of RW.
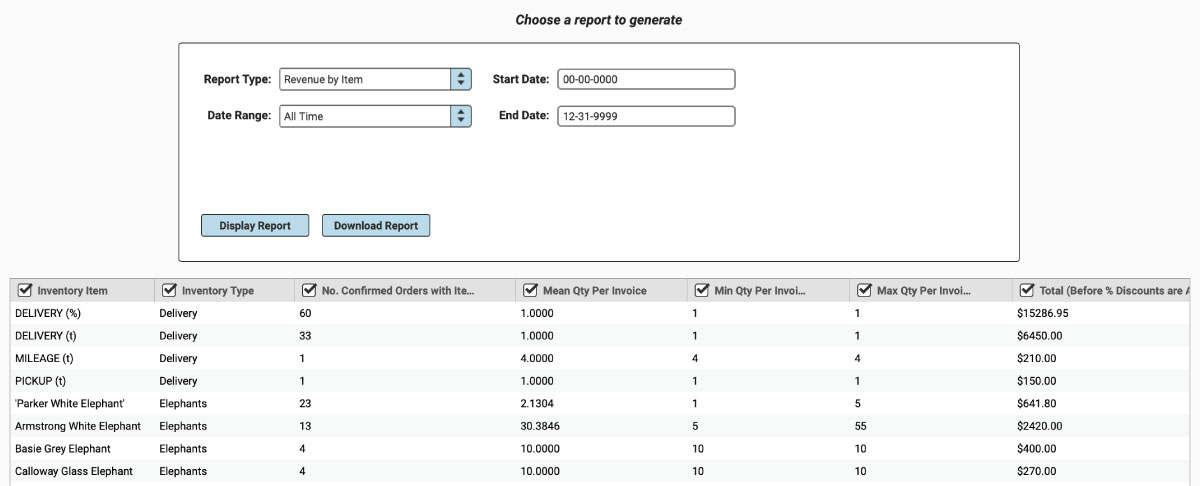
Untick column headers to hide them or drag and drop columns to rearrange them before downloading.
When you’re ready to download, click the “Download Report” button and the Report will generate as a spreadsheet saved to your computer.
Once downloaded, the next time you generate the Report, RW will remember your previous filters and arrangements for quicker downloading.
See also