Click on the Reports icon in the upper left corner of your browser window.
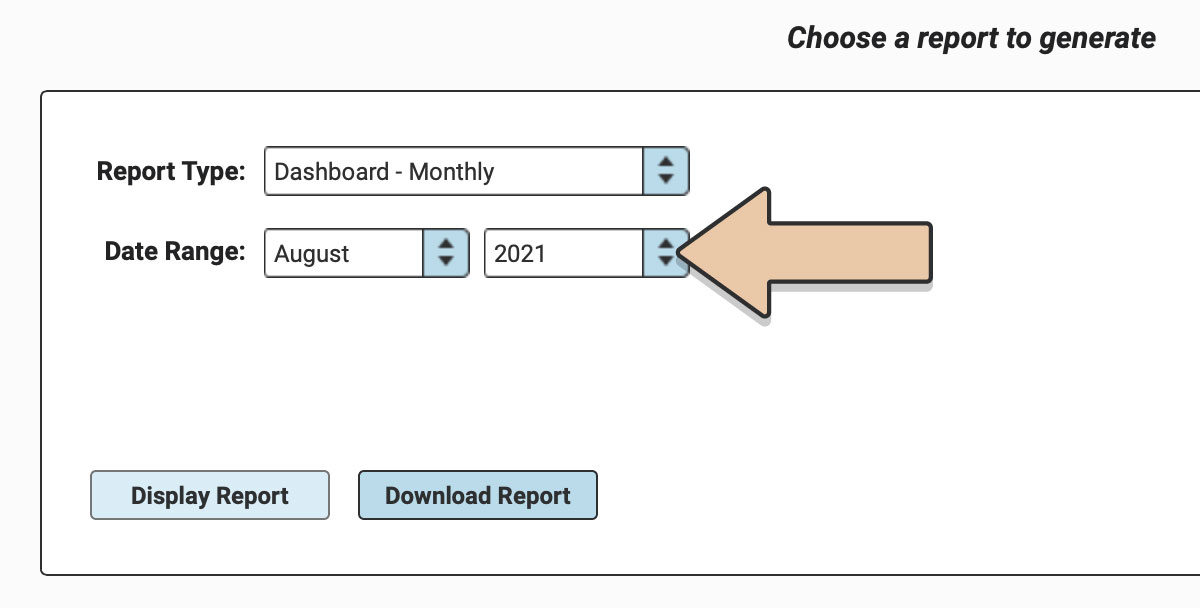
From the Report Type drop-down menu select “Dashboard – Monthly”.
Select the Month & Date from the Date Range drop downs.
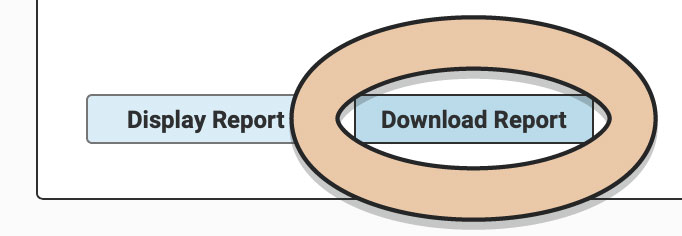
Click “Download Report”.
The report will download to your computer as a spreadsheet.
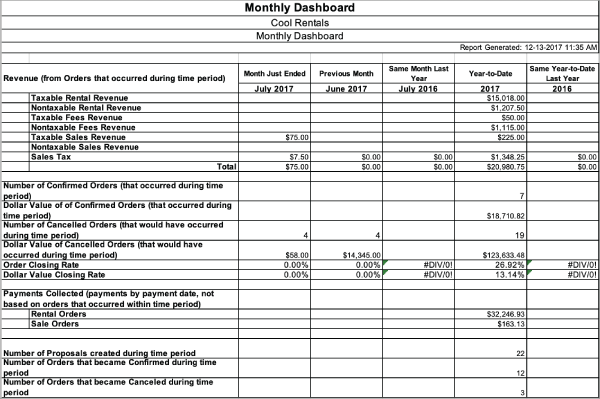
In this report spreadsheet, you can see your Revenue from Orders that occurred during various time periods.
The time periods are as follows with examples in parentheses.
- Month that just ended. (July 2017)
- The month previous to that one. (June 2017)
- The same month last year. (July 2016)
- Your year to date revenue. (1/1/17 to date report was generated i.e. 8/23/17)
- Year to date revenue from the previous year ( 1/1/16 to date report was generated i.e. 8/23/16.)
Revenue will be broken down into the following categories.
- Taxable Rental Revenue
- Nontaxable Rental Revenue
- Taxable Fees Revenue
- Nontaxable Fees Revenue
- Taxable Sales Revenue
- Nontaxable Sales Revenue
- Sales Tax
- Totals
You will also see the following information about your orders that occurred during the same time periods.
- Number of Confirmed Orders
- Dollar Value of Confirmed Orders
- Number of Cancelled Orders
- Dollar Value of Cancelled Orders
- Order Closing Rate
- Dollar Value Closing Rate
- Payments Collected (Payments by payment date, not based on orders that occurred within the time period.)
- Number of Proposals created
- Number of Orders that became confirmed
- Number of Orders that became Cancelled
We hope this report will give you valuable insights to your business and help you do more of what you love.
See also the Weekly Dashboard Report.