The Collection Activity Metric is a scatter plot that measures both the Dollar and the Time Utilization for each item in your inventory.
This Metric helps you answer tough questions like:
“Am I charging enough for this piece?”
“Should I buy more of this piece?”
“Is it time to retire this piece?”
To find this Metric, navigate to the “Metrics” icon in the upper left corner of your browser window.
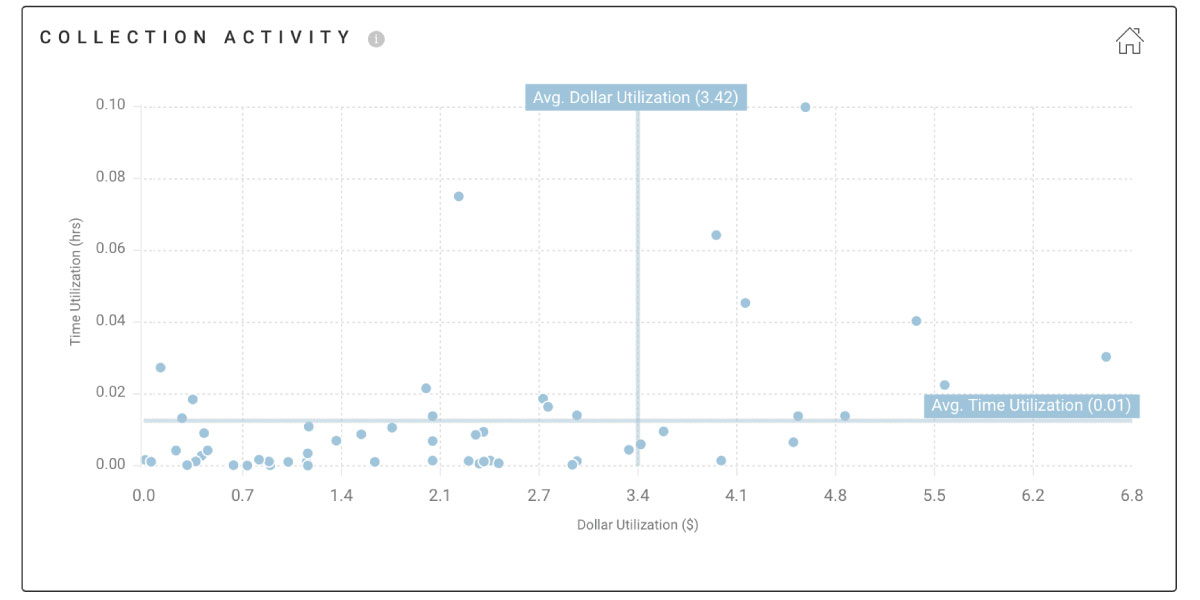
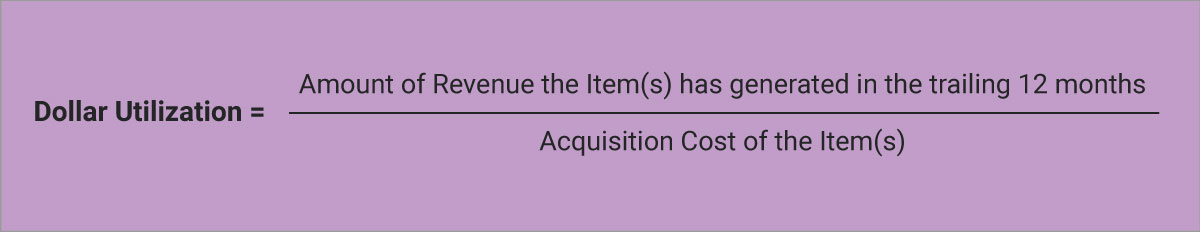
The X-axis represents Dollar Utilization ($). Dollar Utilization takes into consideration the Acquisition Cost of the Item (what you originally purchased it for) and how much revenue it has brought in over the last twelve months.
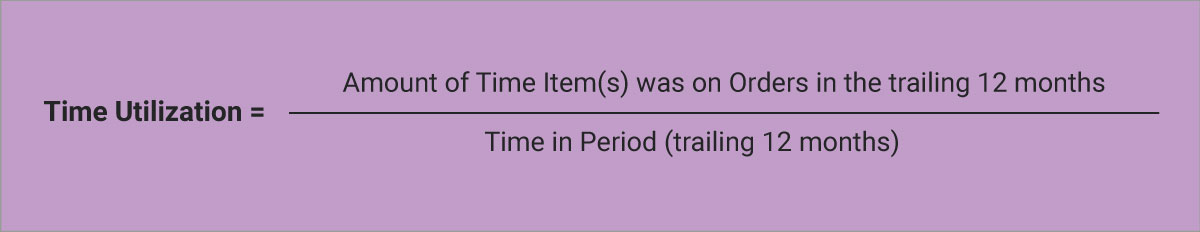
The Y-axis represents Time Utilization (hours). Time Utilization shows the amount of time the Item has been out on Orders compared with the total amount of time in the period.
Hover over a point on the scatter plot to view the specific Item and its Dollar & Time Utilization.

To zoom in to a specific area of the graph, click on the left side of the area you’d like to view and drag the cursor to the right. This will zoom in to the selected section.
Click the home icon in the upper right corner to return to the normal view.
We’ve also included your business’ average Dollar & Time Utilization based across your entire collection. These are represented by light blue lines that create an axis over your scatter plot.
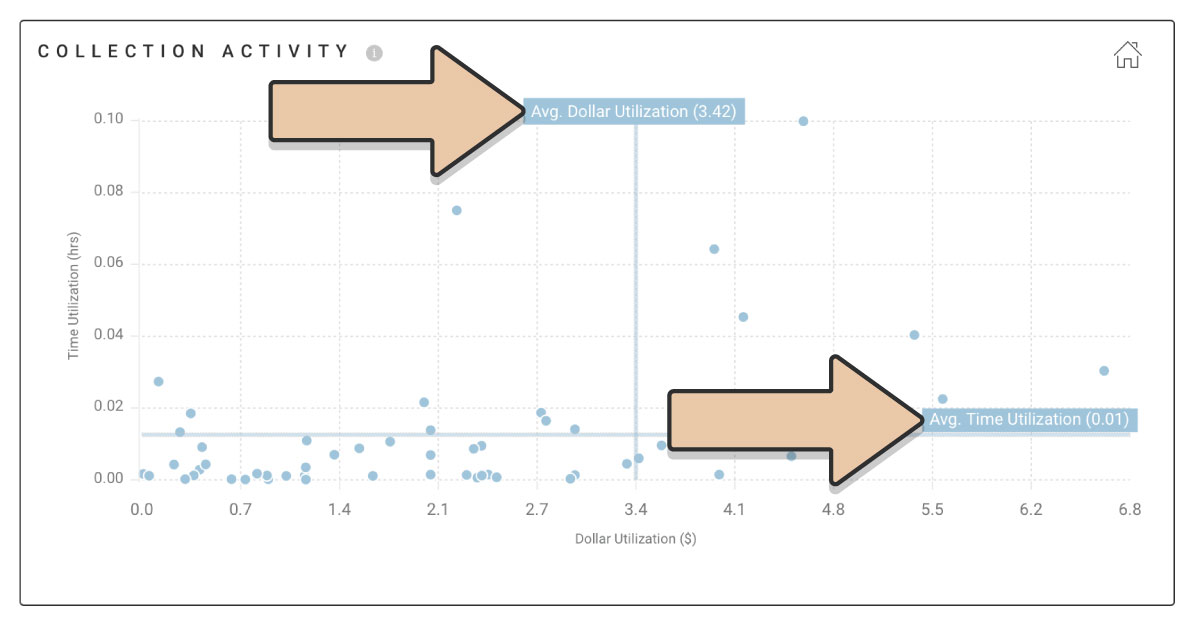
These averages will be unique to your business and are helpful guides to make strategic decisions about your inventory collection.
Why should I keep track of this?
The value in looking at your collection through this lens of Dollar and Time Utilization is that you’re able to compare the performance of different pieces to one another.
For instance, if your Jane Settee has a Dollar Utilization of 1.5 and a Time Utilization of 0.2 but your Susan Settee has a 0.5 Dollar Utilization and a 0.2 Time Utilization, you’ll want to ask yourself why.
Should you increase the price of the Susan? Or perhaps you need to sell it (or both) because they are underperforming the rest of your collection.
Keep in mind that an established event rental business should have a Dollar Utilization of at least 1.0 for the entire collection or something is going wrong. Dollar Utilization in the 3.0 – 6.0 range is fairly typical for boutique event rental businesses.
If your overall collection is underperforming, consider how a different product mix or product volume in your collection might impact your Dollar Utilization.
Time Utilization will vary quite widely from one company to the next. Obviously, we’d all love to have empty warehouses with collections out in the field producing rental revenue for us but that’s not reality. The important thing to remember with time utilization is that you always want to be improving (for your collection as a whole and on a piece-by-piece basis).
Having your collection rent more frequently and for longer periods of time should be a goal.
We’ve gone into more detail about the power that Dollar & Time Utilization gives you in making decisions about your collection in our blog post, Rental Utilization Explained + Two Goals. Plus we share some resource goodies! 🙂